

Quantifying Vegetation Loss Around the Largest U.S. Data Centers with Season-Controlled Sentinel-2 NDVI

Quantifying Vegetation Loss Around the Largest U.S. Data Centers with Season-Controlled Sentinel-2 NDVI
Milan Janosov Geospatial Data Consulting Ltd. milan@janosov.com — www.janosov.com
Abstract
The rapid, AI-driven expansion of hyperscale data centers has recently provoked public alarm about forest destruction, especially on various social media channels, yet the land-cover footprint of these facilities has not been measured systematically to the best of our knowledge. Using free, openly available Sentinel-2 imagery, we quantify vegetation change at the 42 largest U.S. data centers—ranked by estimated annual electricity consumption—and characterize the land cover each site replaced. We find that the largest U.S. data centers are built overwhelmingly on cropland and previously developed land: of the roughly 51 km² of combined footprints, converted cropland accounts for about 60% and already-developed land about 26%, with forest only about 6% (and shrub/grassland about 6%). The same ranking holds by dominant per-site class (cropland 45% of sites, developed 40%, forest 7%, shrub/grassland 7%). To measure change without the seasonal bias that undermines naive before-and-after comparisons, we build cloud-free, phenology-matched (peak-greenness) annual NDVI composites over 2017–2026 and difference each site’s footprint against its own surrounding reference zone, isolating on-site conversion from regional weather and crop-cycle variation. Nineteen sites show a detectable construction break (2020–2025, peaking in 2023); fourteen show a substantial NDVI loss (ΔNDVI ≥ 0.15; median 0.35, maximum 0.54), spatially confined to the footprint. Pre-construction land cover is drawn from a fixed 2018 National Land Cover Database baseline. Forest conversion is real and produces the clearest losses where it occurs, but on the evidence of only three forest sites it is atypical among the highest-consumption facilities—reframing, rather than confirming, a viral claim of widespread data-center deforestation.
1. Motivation — a viral image and a divided reaction
This study was prompted by a collection of images that spread widely on social media during the summer of 2026. It presented a series of paired before-and-after satellite images appearing to show data centers built over cleared forest. The reaction was intense and sharply divided, and the shape of that debate defines the questions this paper sets out to answer.
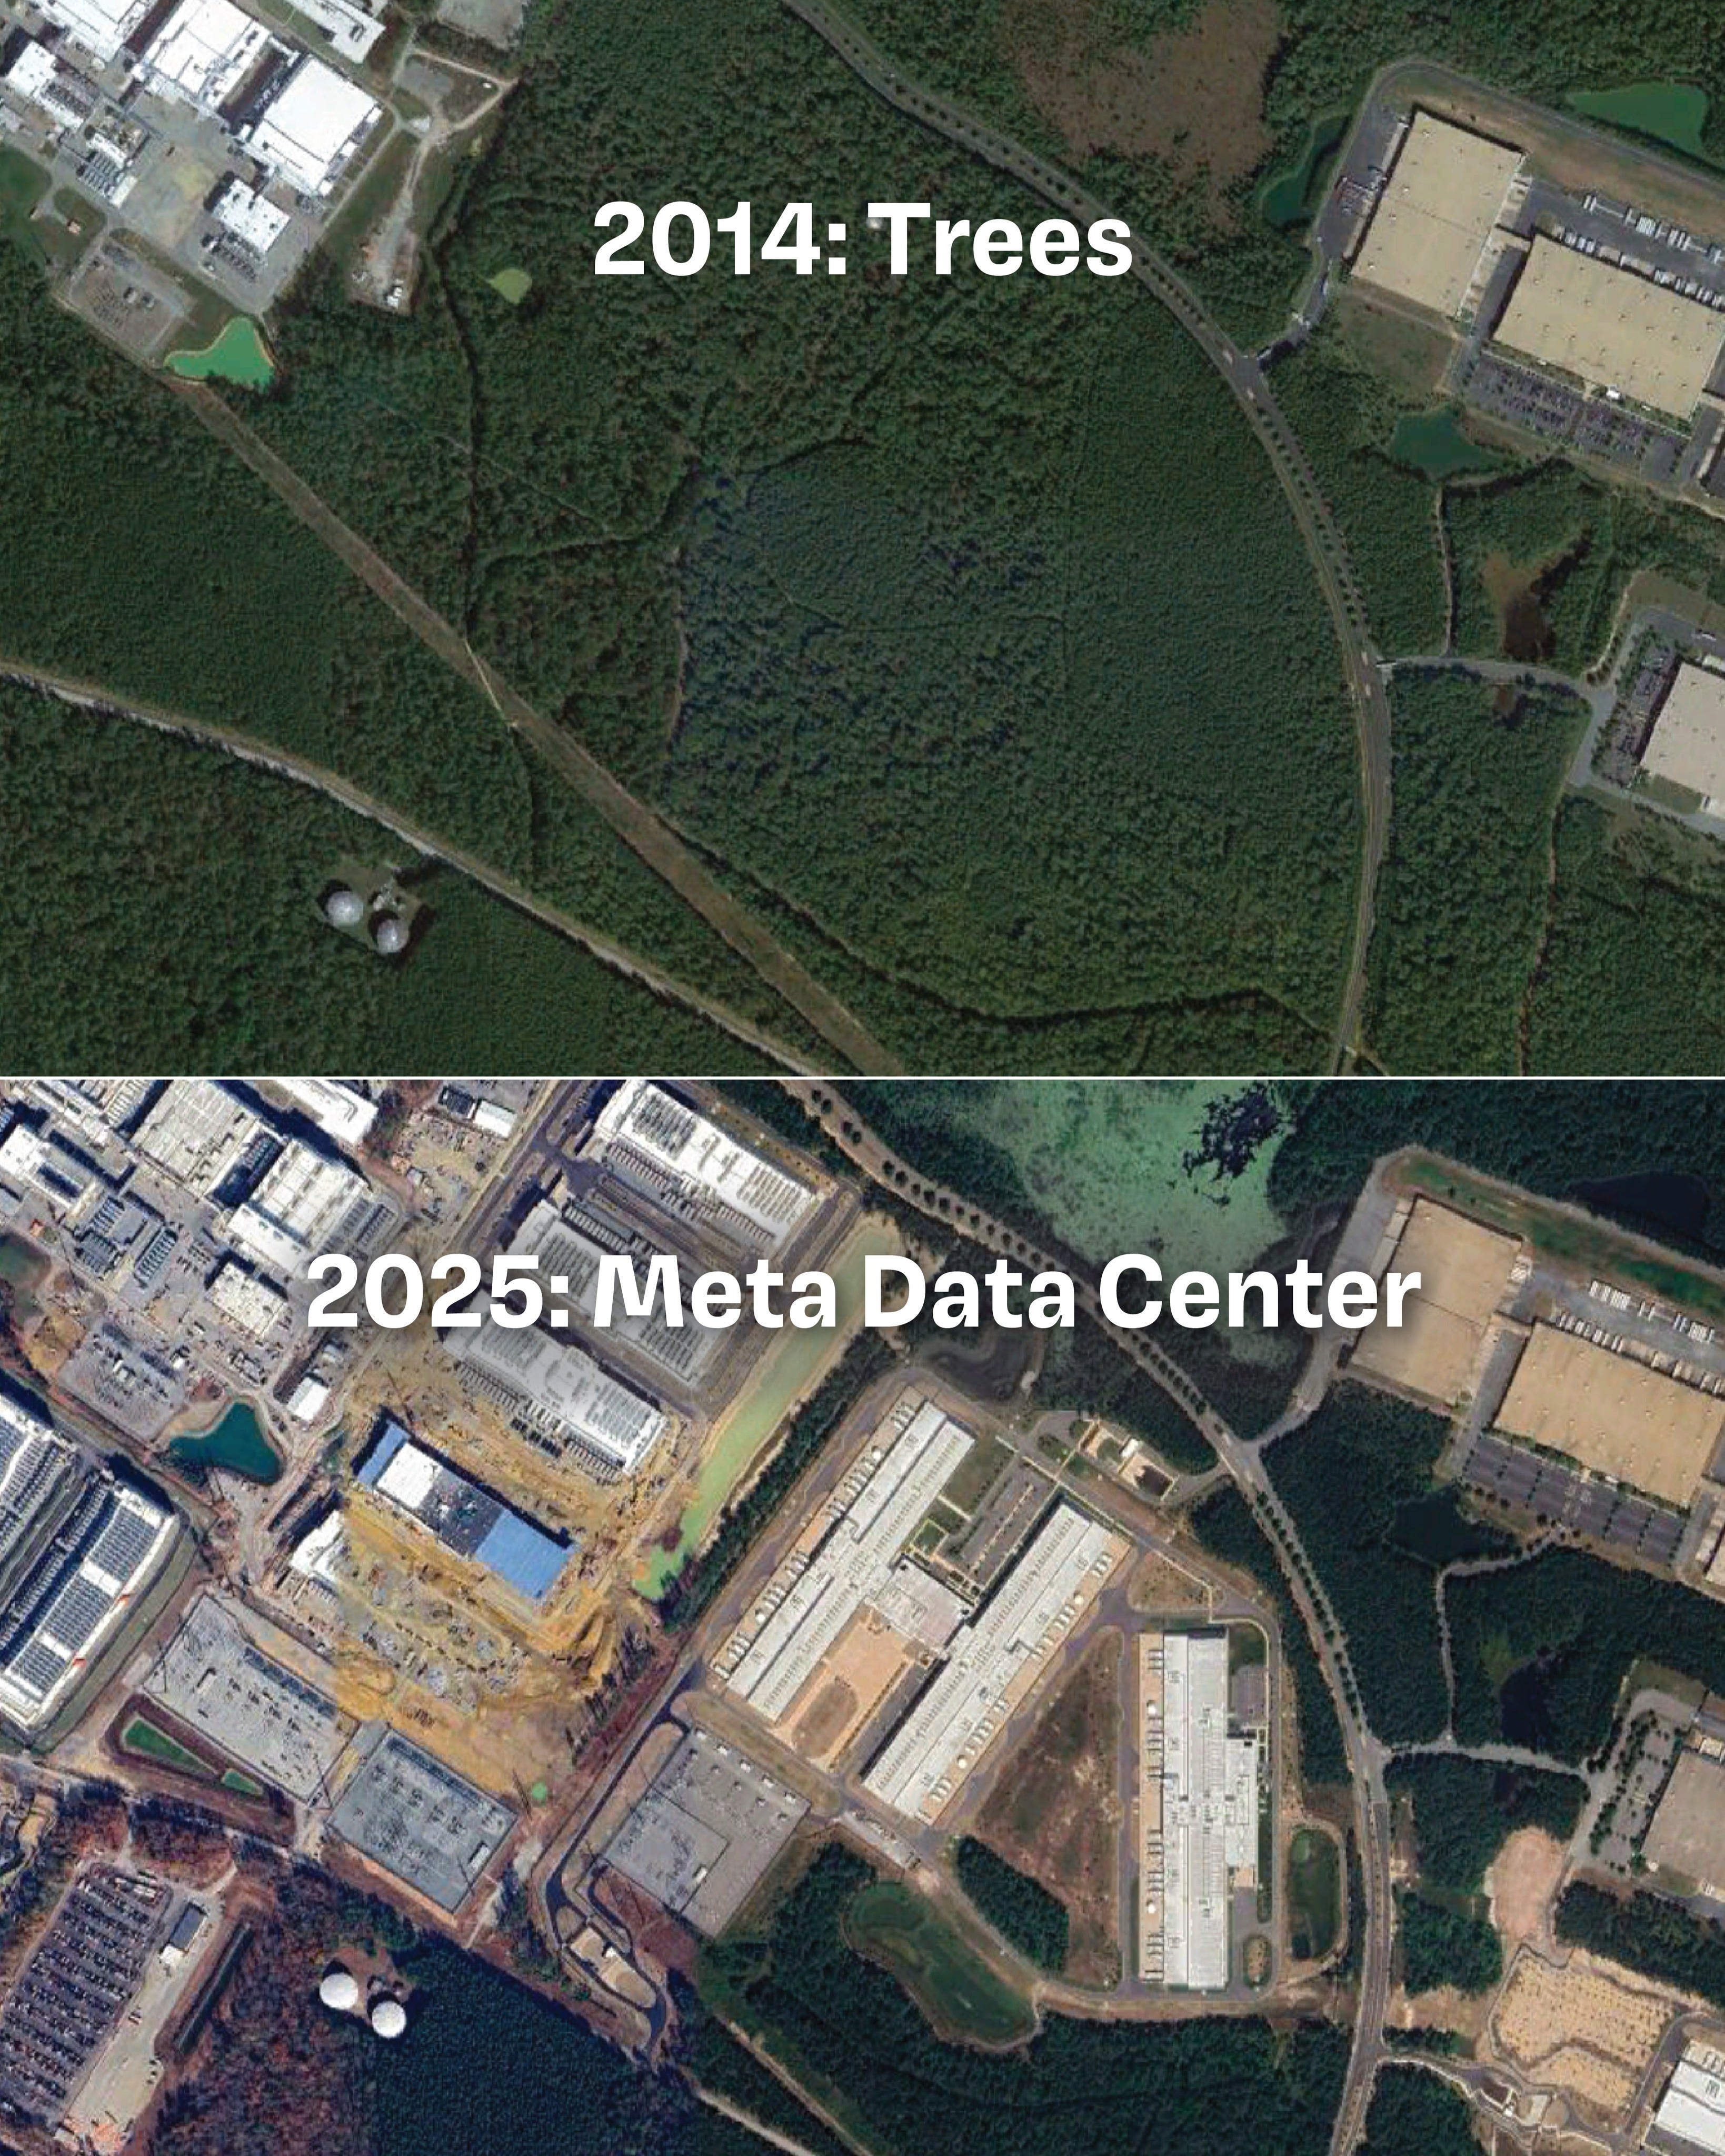
The dominant response was visceral, heavily emotional concern about deforestation. A second, substantial strand pushed back on the framing—not to defend data centers, but to argue that the images highlighted the wrong impact. Many held that the energy and water footprint of data centers dwarfs their land footprint, noting that electricity consumption is a far larger environmental problem than deforestation. Others observed that the potential forest loss is likely comparable in scale to ordinary industrial development, and nowhere near the large-scale agricultural deforestation seen in developing countries. A further hypothesis raised the possibility of seasonal bias, suggesting that some of the paired images compared snapshots of vegetation captured in different seasons rather than genuine, permanent loss.
Taken together, the online debate drew attention to a legitimate problem and, at the same time, offered an opportunity for geospatial data science to address aspects of it with factual data: is the vegetation loss real, how large is it, where is it concentrated, and—most importantly—what kind of land are the largest data centers actually being built on? This paper answers these questions systematically, replacing a viral image with a season-controlled, reproducible measurement across the largest data-center facilities in the United States.
2. Introduction and Related Work
Research on the environmental impact of hyperscale data centers has focused overwhelmingly on energy and water use, with little attention to their direct footprint on land and vegetation. We review the literature across six themes and identify the gap this study addresses: an open, reproducible, multi-site measurement of how much vegetation each hyperscale data center removed—where, when, and from what pre-construction land cover.
The environmental footprint of data centers: energy and water, not land
The environmental literature on data centers is dominated by energy and water. Mytton showed that data-center water use is far less studied than energy use, and that transparency is poor: in the United States, direct data-center water consumption is small relative to national totals, yet fewer than a third of operators even measure it. Siddik, Shehabi and Marston produced the first spatially detailed carbon and water footprints of U.S. data centers, finding that about one-fifth of servers’ direct water footprint falls in moderately-to-highly water-stressed watersheds, and that nearly half of servers are at least partly powered by plants in water-stressed regions. This body of work frames the conversation around operational resource use. What remains largely unexamined is the land-cover conversion—the vegetation physically removed—caused by construction itself. That is the gap this study targets.
Satellite-based studies of data-center land impact
A small but growing set of efforts uses satellite imagery to observe data centers, but none quantify vegetation loss. Epoch AI’s Frontier Data Centers Hub tracks the construction, power, and compute of major U.S. AI data centers from satellite imagery, public permits, and other open sources. The Federation of American Scientists report by Krawec uses electro-optical satellite imagery to track construction progress and provide independent verification of operators’ announcements, in support of AI governance. Journalism, including a Business Insider investigation, has published before-and-after image pairs illustrating landscape change at individual sites. All of these track construction, power, or cooling; none compute a vegetation index across a multi-site sample, and none stratify loss by pre-construction land cover. To our knowledge, no existing study provides a systematic, multi-site, NDVI-based measurement of data-center-driven vegetation loss by prior cover type.
NDVI and Sentinel-2/Landsat time series for land-conversion detection
Our method builds on decades of validated remote sensing. The Normalized Difference Vegetation Index, NDVI = (NIR − Red) / (NIR + Red), was popularized by Tucker and remains the most widely used measure of vegetation greenness. At global scale, Hansen et al. used Landsat time series to map forest loss and gain at 30 m resolution, establishing satellite change detection as a rigorous quantitative tool. At the higher resolution and faster revisit our study needs, Sentinel-2 has been used to track urban expansion and vegetation loss: Herbei et al., for example, documented the multi-stage conversion of peri-urban vegetation into built-up surfaces using Sentinel-2 NDVI and NDBI. Together, this work confirms that NDVI change detection on Landsat and Sentinel-2 time series is well established for the kind of land conversion we measure.
Cloud-free compositing, phenology-aware comparison, and reference differencing
Several choices underpin our pipeline. First, we build cloud-free annual composites by taking the per-pixel median across many scenes—a standard way to remove clouds from optical time series, used at global scale for Sentinel-2 by Corbane et al. Second, we mask clouds using the Sentinel-2 Scene Classification Layer from the Sen2Cor Level-2A processor; validation by Baetens et al. reported an overall accuracy of about 84% for Sen2Cor’s masks, which median compositing over many scenes further mitigates. Third, because NDVI varies strongly with the growing season, we compare the same phenological stage across years, using peak-of-season greenness. Finally, we separate the site-specific signal from region-wide baseline conditions using reference zones—a control-region logic; we borrow from Lovell et al. only the caution that a poorly matched control can mislead.
NLCD and land-cover baselines for quantifying conversion
To identify what each footprint replaced, we use the USGS Annual National Land Cover Database (NLCD), a 30 m Landsat-based product classifying the conterminous United States into standard land-cover classes. NLCD is well established for quantifying land conversion: Yang et al. described the design of the modern NLCD generation, and Homer et al. used it to quantify land-cover change across the United States, including developed-land growth. Crossing NLCD classes with NDVI-loss pixels lets us report how much forest, cropland, and shrub/grassland each site converted.
The AI-compute build-out driving the study
The urgency comes from the sharp rise in data-center demand since roughly 2021. The Lawrence Berkeley National Laboratory 2024 U.S. Data Center Energy Usage Report estimated that data centers used about 4.4% of U.S. electricity in 2023 and projected 6.7–12% by 2028. The IEA’s Energy and AI report estimated about 1.5% of global electricity in 2024, projected to roughly double by 2030, with the United States holding both the largest share and the largest projected increase.
The gap and our contribution
In short: the data-center literature quantifies energy and water but not the land and vegetation removed by construction; the few satellite-based efforts track construction, power, and cooling but never measure vegetation loss or stratify it by prior land cover; and the remote-sensing methods needed to close this gap are individually mature. Building on our prior geospatial work on U.S. data-center siting, this study provides, to our knowledge, the first open, reproducible, multi-site NDVI measurement of how much vegetation the largest U.S. hyperscale data centers removed—where, when, and from what pre-construction cover—with three contributions: (a) reference differencing against a control zone to remove weather and crop-cycle confounds; (b) phenology-matched peak-greenness compositing, with the peak month detected from metadata; and (c) footprint-level stratification of loss by NLCD land cover.
3. Data and site selection
Our sample of study sites is drawn from a public database of United States data-center locations compiled and mapped by Business Insider as part of its reporting on the AI-driven data-center boom. The dataset provides, for each facility, a name/operator, geographic coordinates, and an estimated annual electricity consumption expressed as a low–high range in MWh per year—a proxy for facility scale rather than a measured value.
From this database of roughly a thousand facilities, we selected the largest by estimated annual consumption, applying a floor of 100,000 MWh/year (upper-bound estimate) to restrict the analysis to genuinely hyperscale sites. We ranked and filtered by energy as a scale proxy while noting explicitly that energy consumption is not equivalent to land area—a compute-dense facility on a small parcel may consume more power than a sprawling one, so energy ranking is an imperfect stand-in for physical footprint. This selection yields a manageable sample that can be individually inspected and quality-controlled, which is essential given that automated footprint delineation is error-prone at these sites.
Footprint cleaning
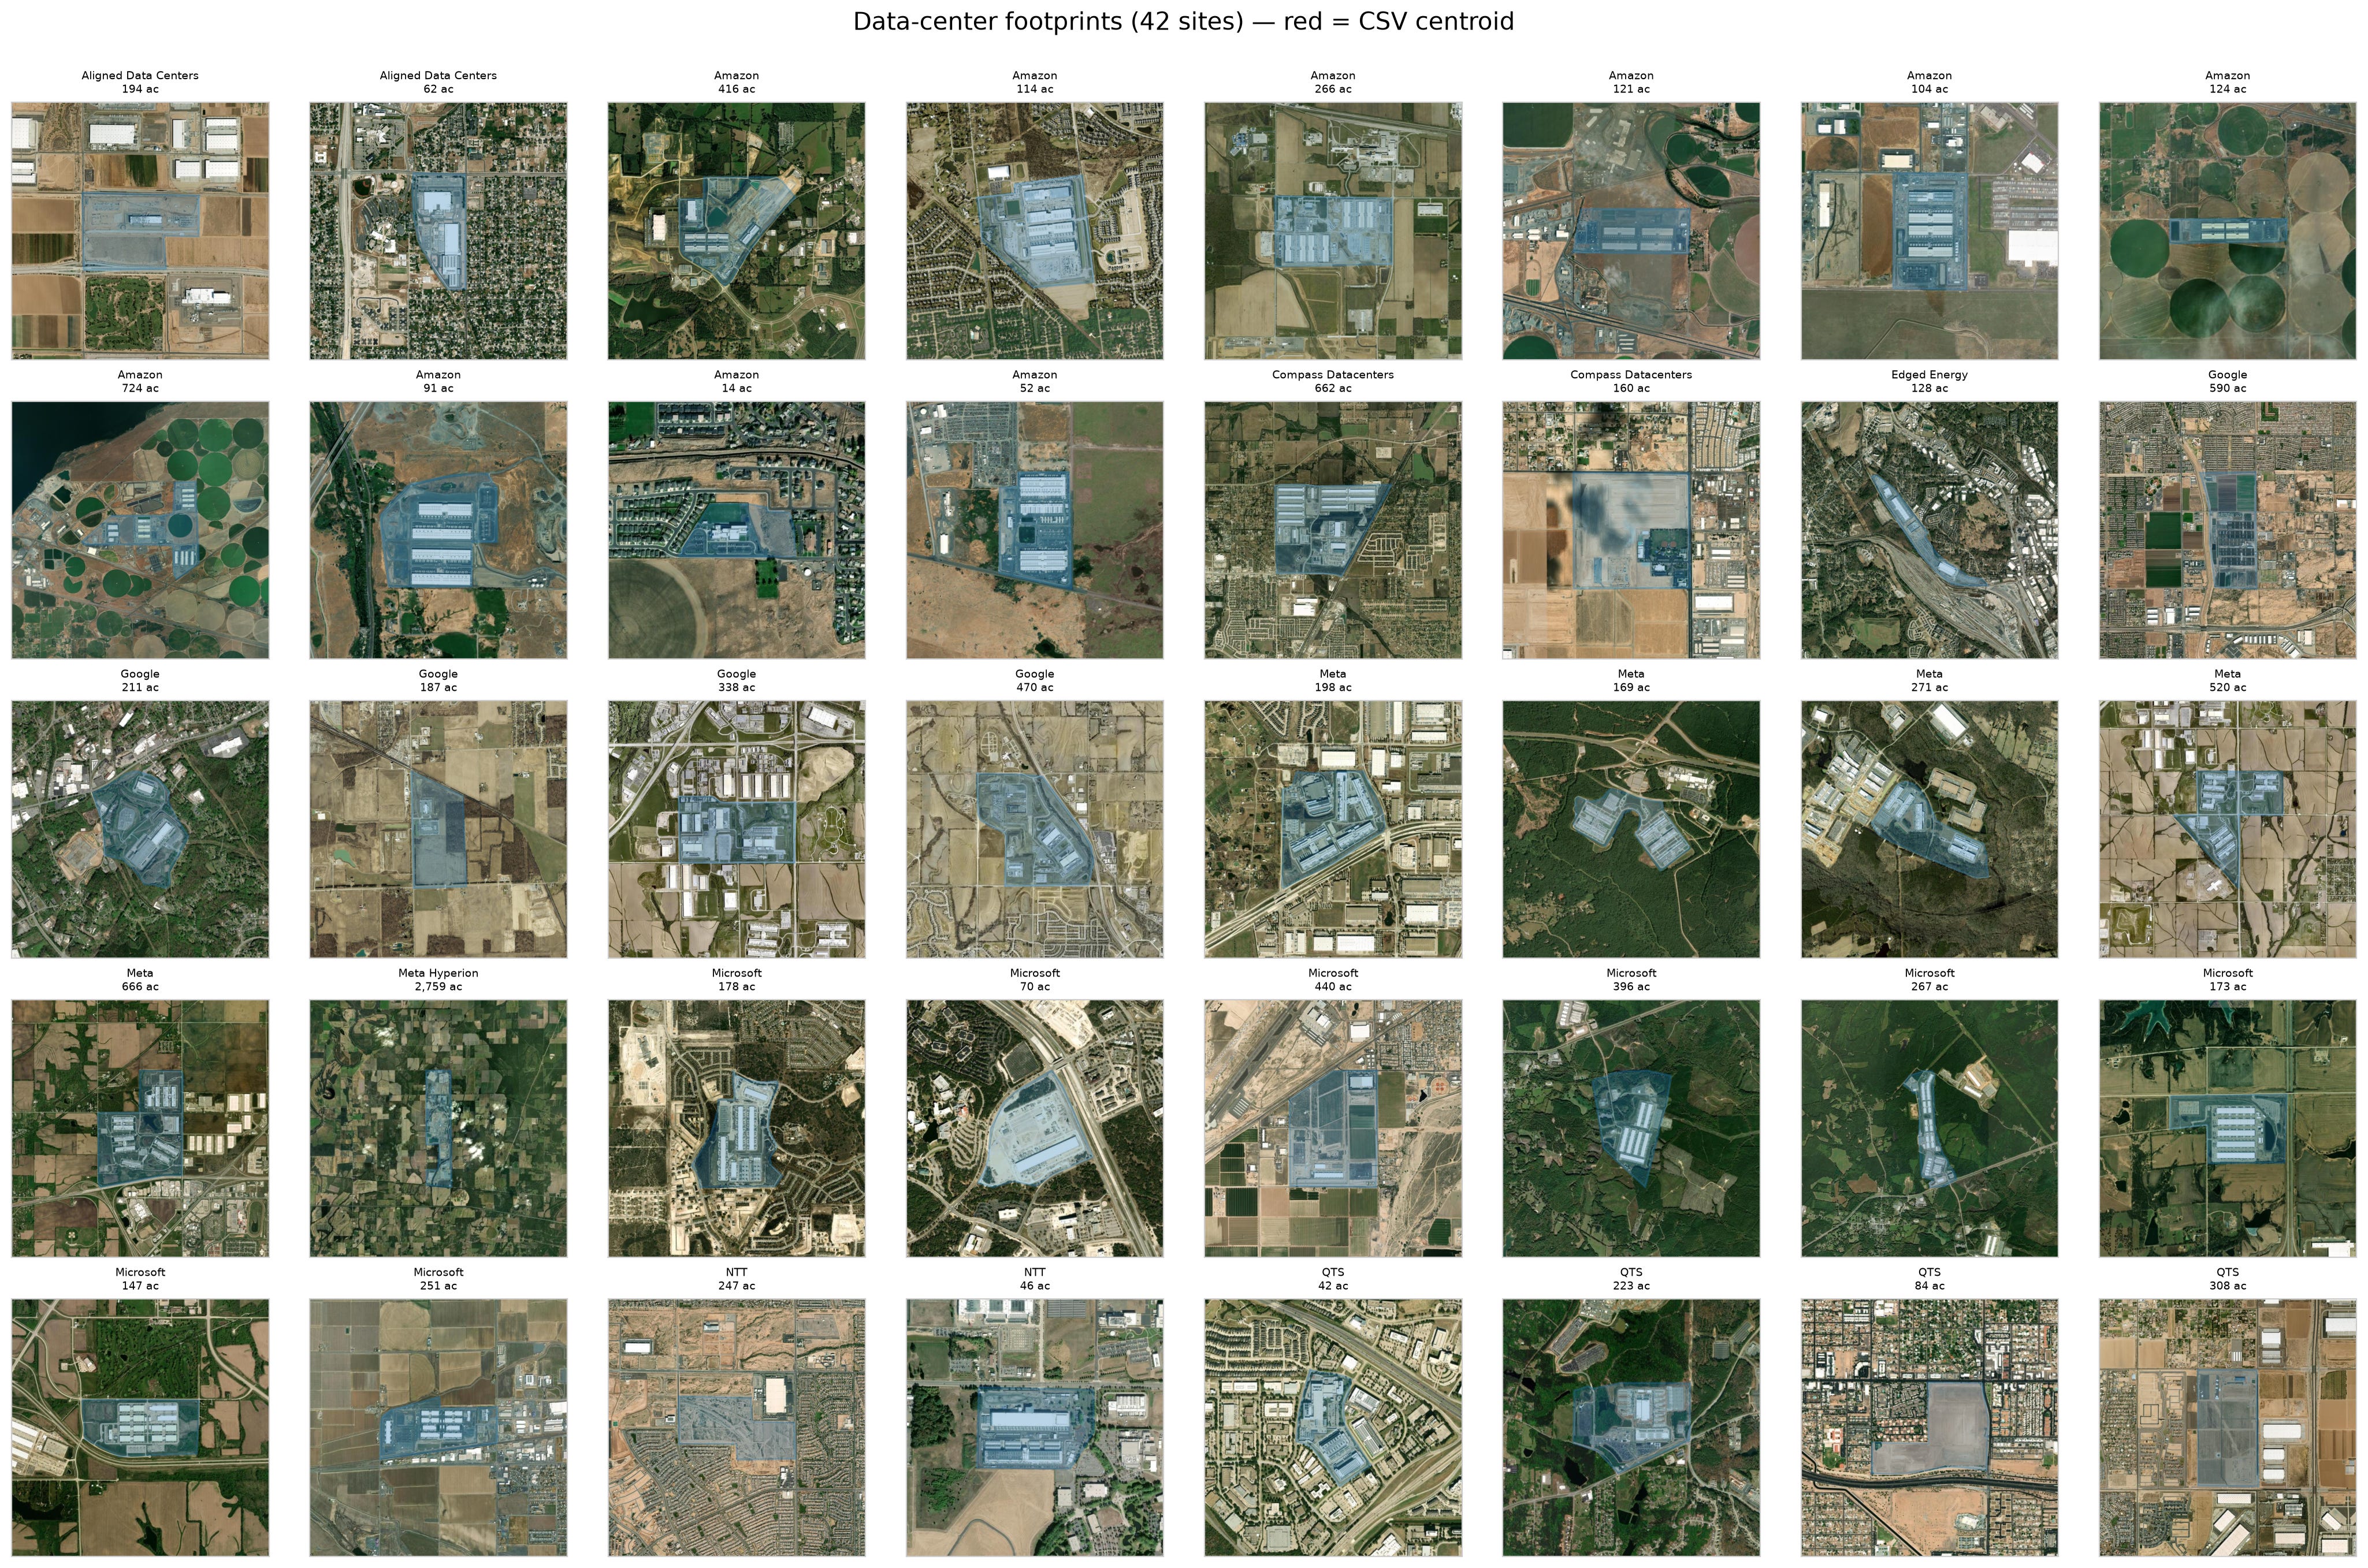
Because the source database provides only point coordinates—not building or parcel geometry—and because many large campuses are recorded as several closely spaced points, and typically not annotated on platforms like OpenStreetMap, the raw locations required substantial cleaning before they could serve as analysis units. We spatially deduplicated the points by buffering each location and dissolving overlapping buffers into single campuses, so that multi-building sites mapped as several points collapsed to one site; where energy estimates were duplicated across a campus’s points we retained the maximum rather than summing them. After deduplication, and after merging a small number of remaining co-located pairs identified by proximity, the final sample comprised 42 distinct campuses.
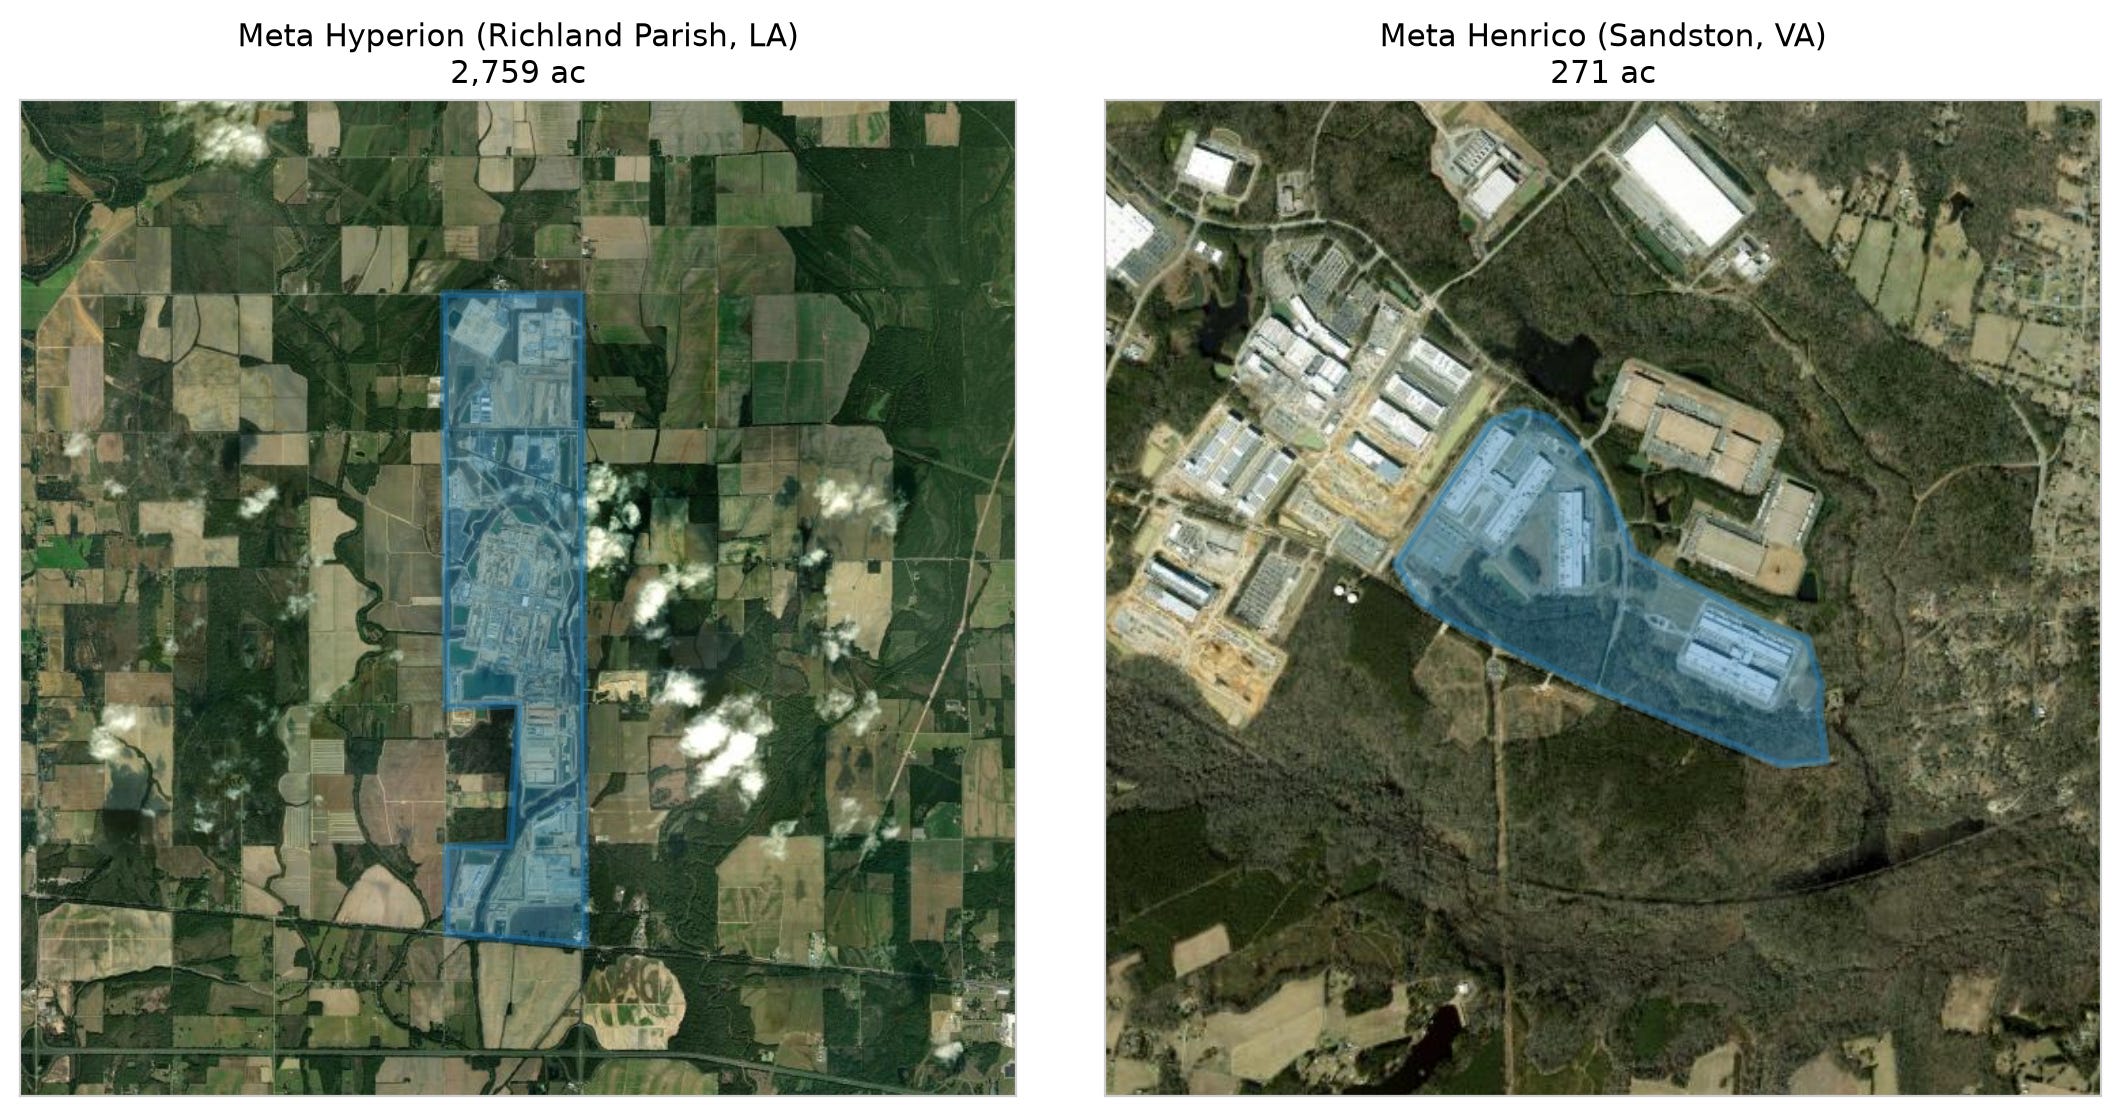
For each site we geocoded the actual footprint by hand, following a combined approach of Google Earth satellite views and OpenStreetMap annotation, tracing the operator’s own buildings and cleared area and deliberately excluding neighboring facilities that share the same industrial park. This manual step was necessary because automated approaches proved unreliable: querying OpenStreetMap for the nearest or largest building frequently returned a neighbor’s structure or merged adjacent operators’ campuses, and building coverage was absent for many newer sites. For campuses mapped as a single named land-use or construction parcel we used that parcel; for those mapped as multiple buildings we unioned the operator’s buildings; and multipart geometries were cleaned by retaining only the components matching each site’s own centroid.
4. Methods
Our method quantifies vegetation change at each data center from free, openly available Sentinel-2 imagery, using a pipeline designed to be reproducible up to a documented visual-confirmation step and to control for the seasonal and weather confounds that undermine naive before-and-after image comparisons.
Imagery and study grid. We access Sentinel-2 Level-2A surface-reflectance imagery through a public SpatioTemporal Asset Catalog (STAC) via the Element 84 / AWS Earth Search catalog, reading only the small window over each site directly from Cloud-Optimized GeoTIFFs on cloud storage—no bulk downloads. For each site we define a 20 × 20 km study area centered on the campus, projected to the local UTM zone and rasterized to a 10 m grid, matching the native resolution of the Sentinel-2 red and near-infrared bands. Every image is warped onto this common grid, so that all years are pixel-aligned.
Vegetation index. We use the Normalized Difference Vegetation Index (NDVI), computed from the red and near-infrared bands as (NIR − Red) / (NIR + Red). NDVI is near zero for bare soil, concrete, and water, and approaches 0.9 for dense healthy vegetation, so the conversion of vegetated land to data-center buildings and pavement produces a sharp, localized NDVI decline.
Cloud-free annual composites. A single satellite pass is frequently obscured by cloud, and our study areas can straddle the seam between adjacent Sentinel-2 tiles. We address both problems simultaneously with median compositing. For each scene we build a cloud-and-shadow mask from the Scene Classification Layer (SCL), discarding pixels flagged as cloud, cloud shadow, cirrus, or no-data. We then take, per pixel, the median of all valid observations across a window of scenes, which fills cloud gaps (a pixel obscured on one date is usually clear on another), stitches across tile boundaries, and is robust to residual haze. The result is one clean NDVI image per year.
Season control. To avoid the seasonal bias that can make ordinary before/after comparisons misleading—the central methodological objection raised in the public reaction to this topic—we do not compare arbitrary dates. Instead, for each site we identify its peak-greenness month directly from catalog metadata (the month with the highest vegetation fraction across baseline years), and build every annual composite from a window centered on that same month. Each year is therefore compared at the same phenological moment, so that observed change reflects land conversion rather than the time of year. We build one composite per year over 2017–2026, the span of the two-satellite Sentinel-2 archive.
Isolating the site signal. Even season-matched NDVI varies year to year with weather, drought, and—for agricultural sites—crop rotation. To remove this shared regional variation, we measure NDVI not in absolute terms but relative to each site’s own surroundings. Within each study area we define the site footprint (the traced campus) plus a series of concentric rings extending outward to 3 km, and a reference zone comprising the rest of the tile beyond the outer ring. We then difference the footprint (and each ring) against the reference in every year. This reference-differencing cancels region-wide fluctuations—a drought year lowers NDVI everywhere and largely disappears from the difference—leaving a signal specific to the site. Where a hand-traced footprint is unavailable, a disk around the site centroid serves as a tagged fallback. Throughout, reference-differenced values are reported as signed quantities (negative where the footprint is less green than its surroundings), while loss magnitudes (ΔNDVI) are reported as positive numbers.
Reading the result
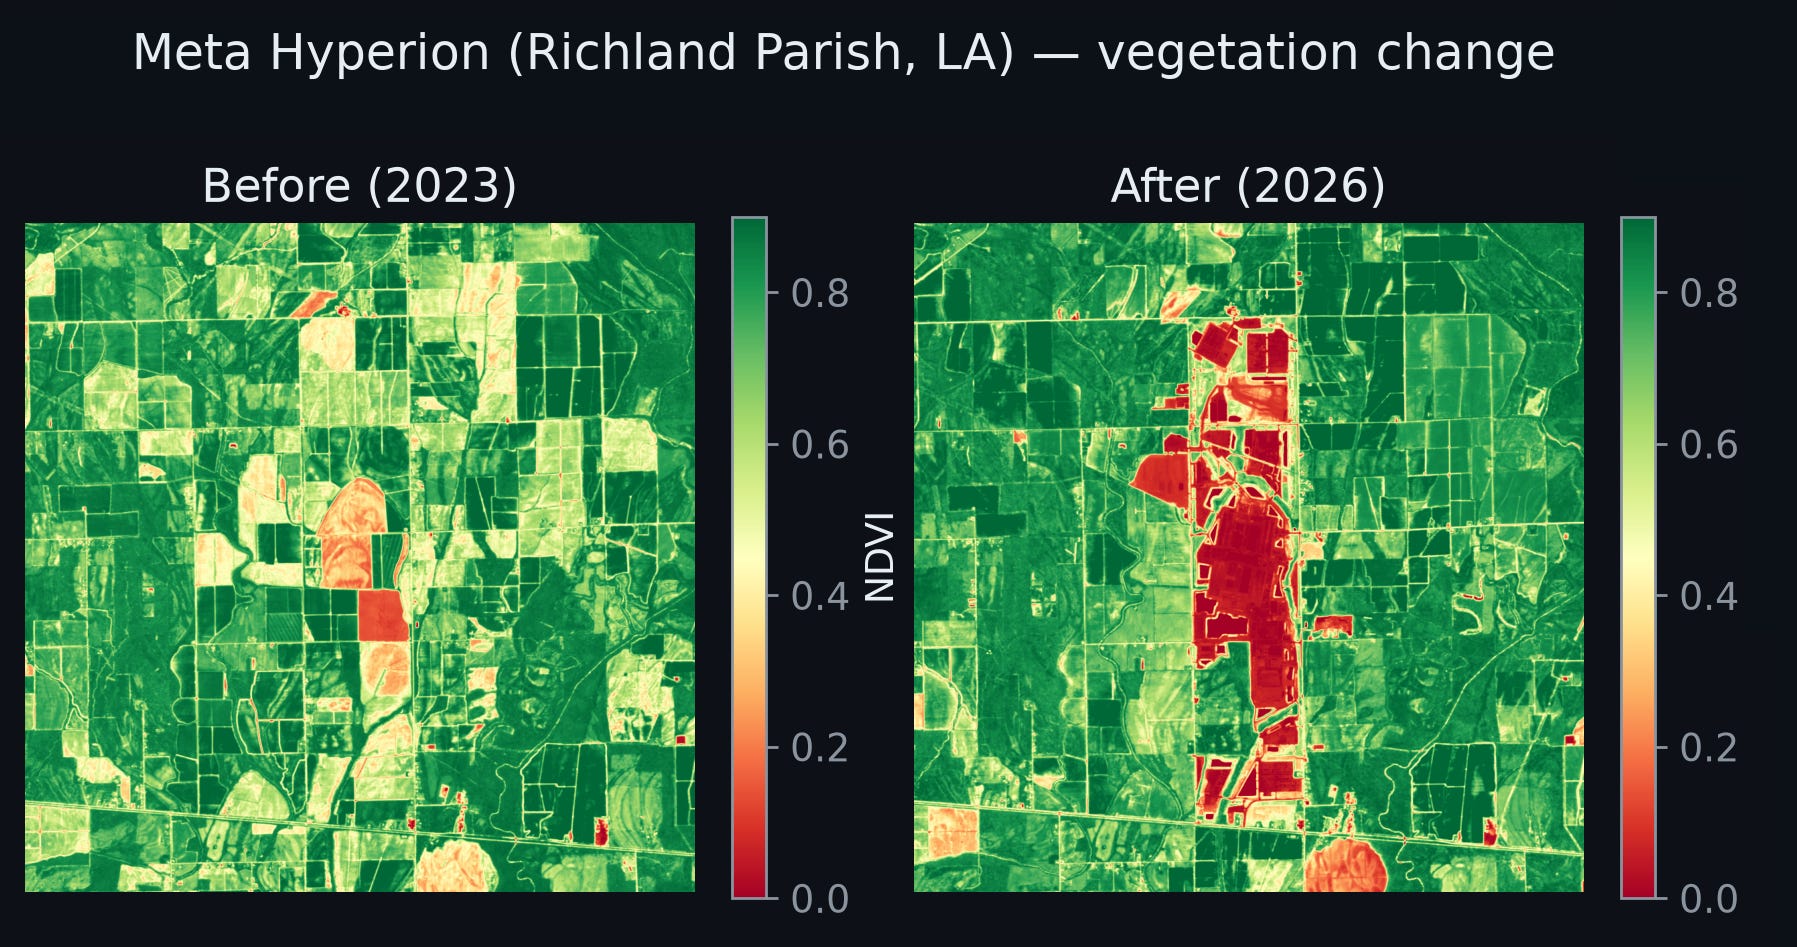
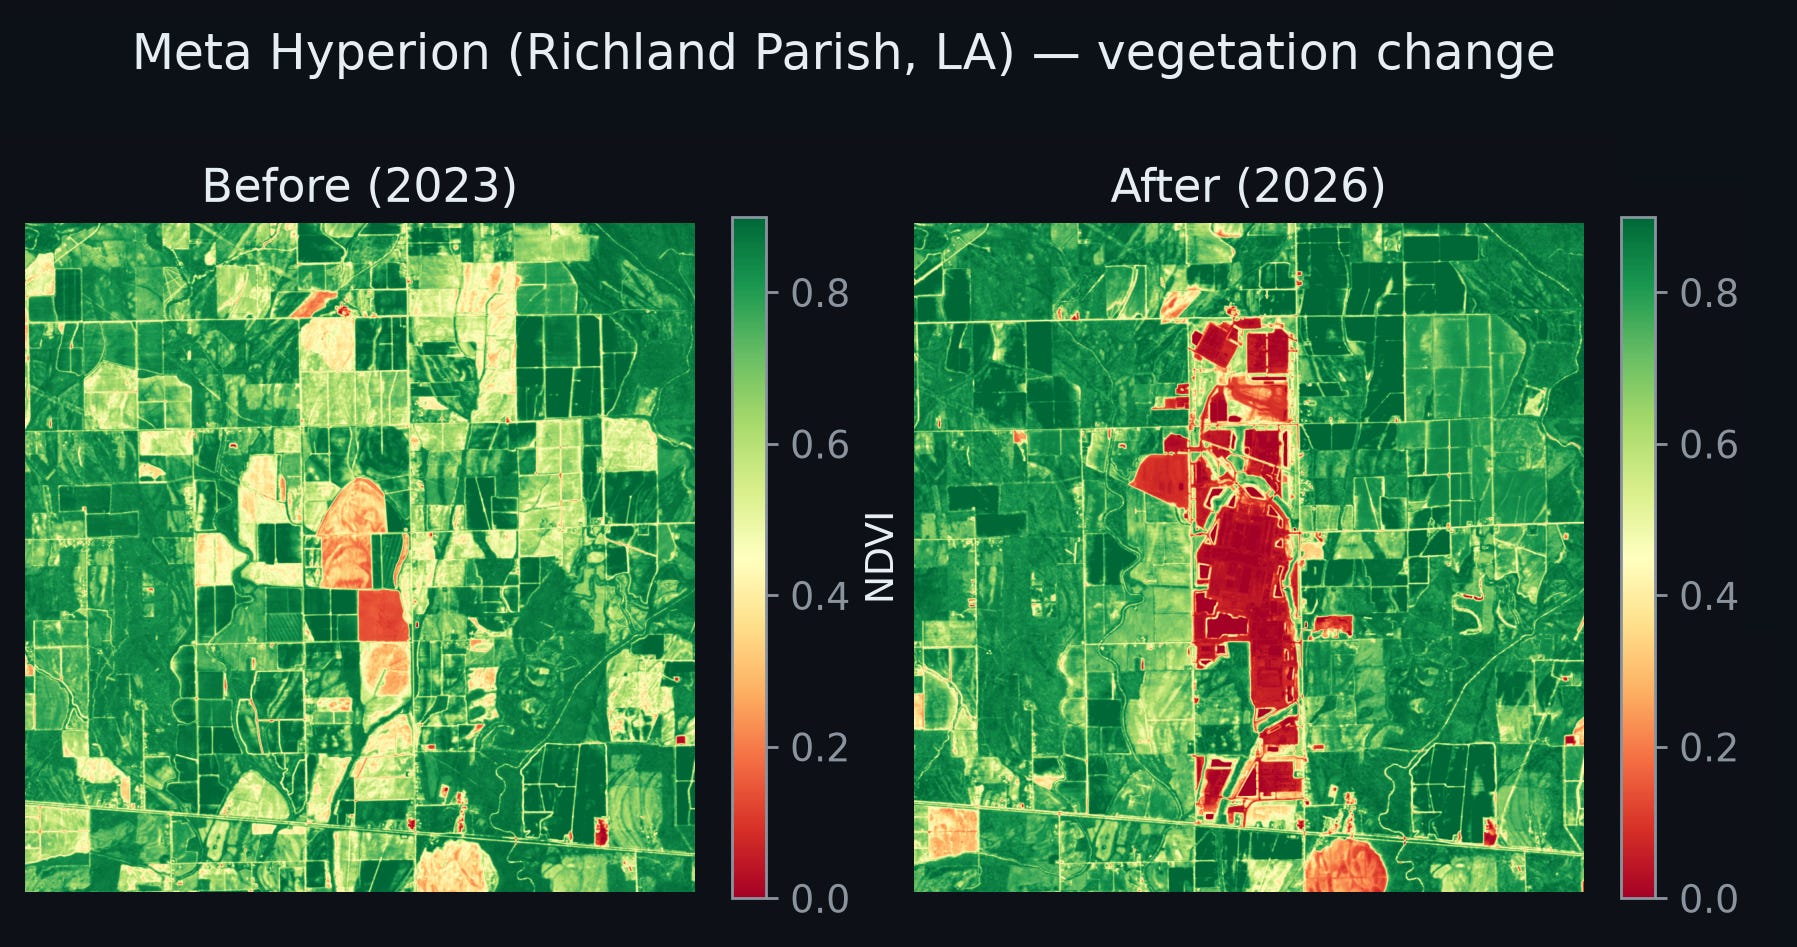
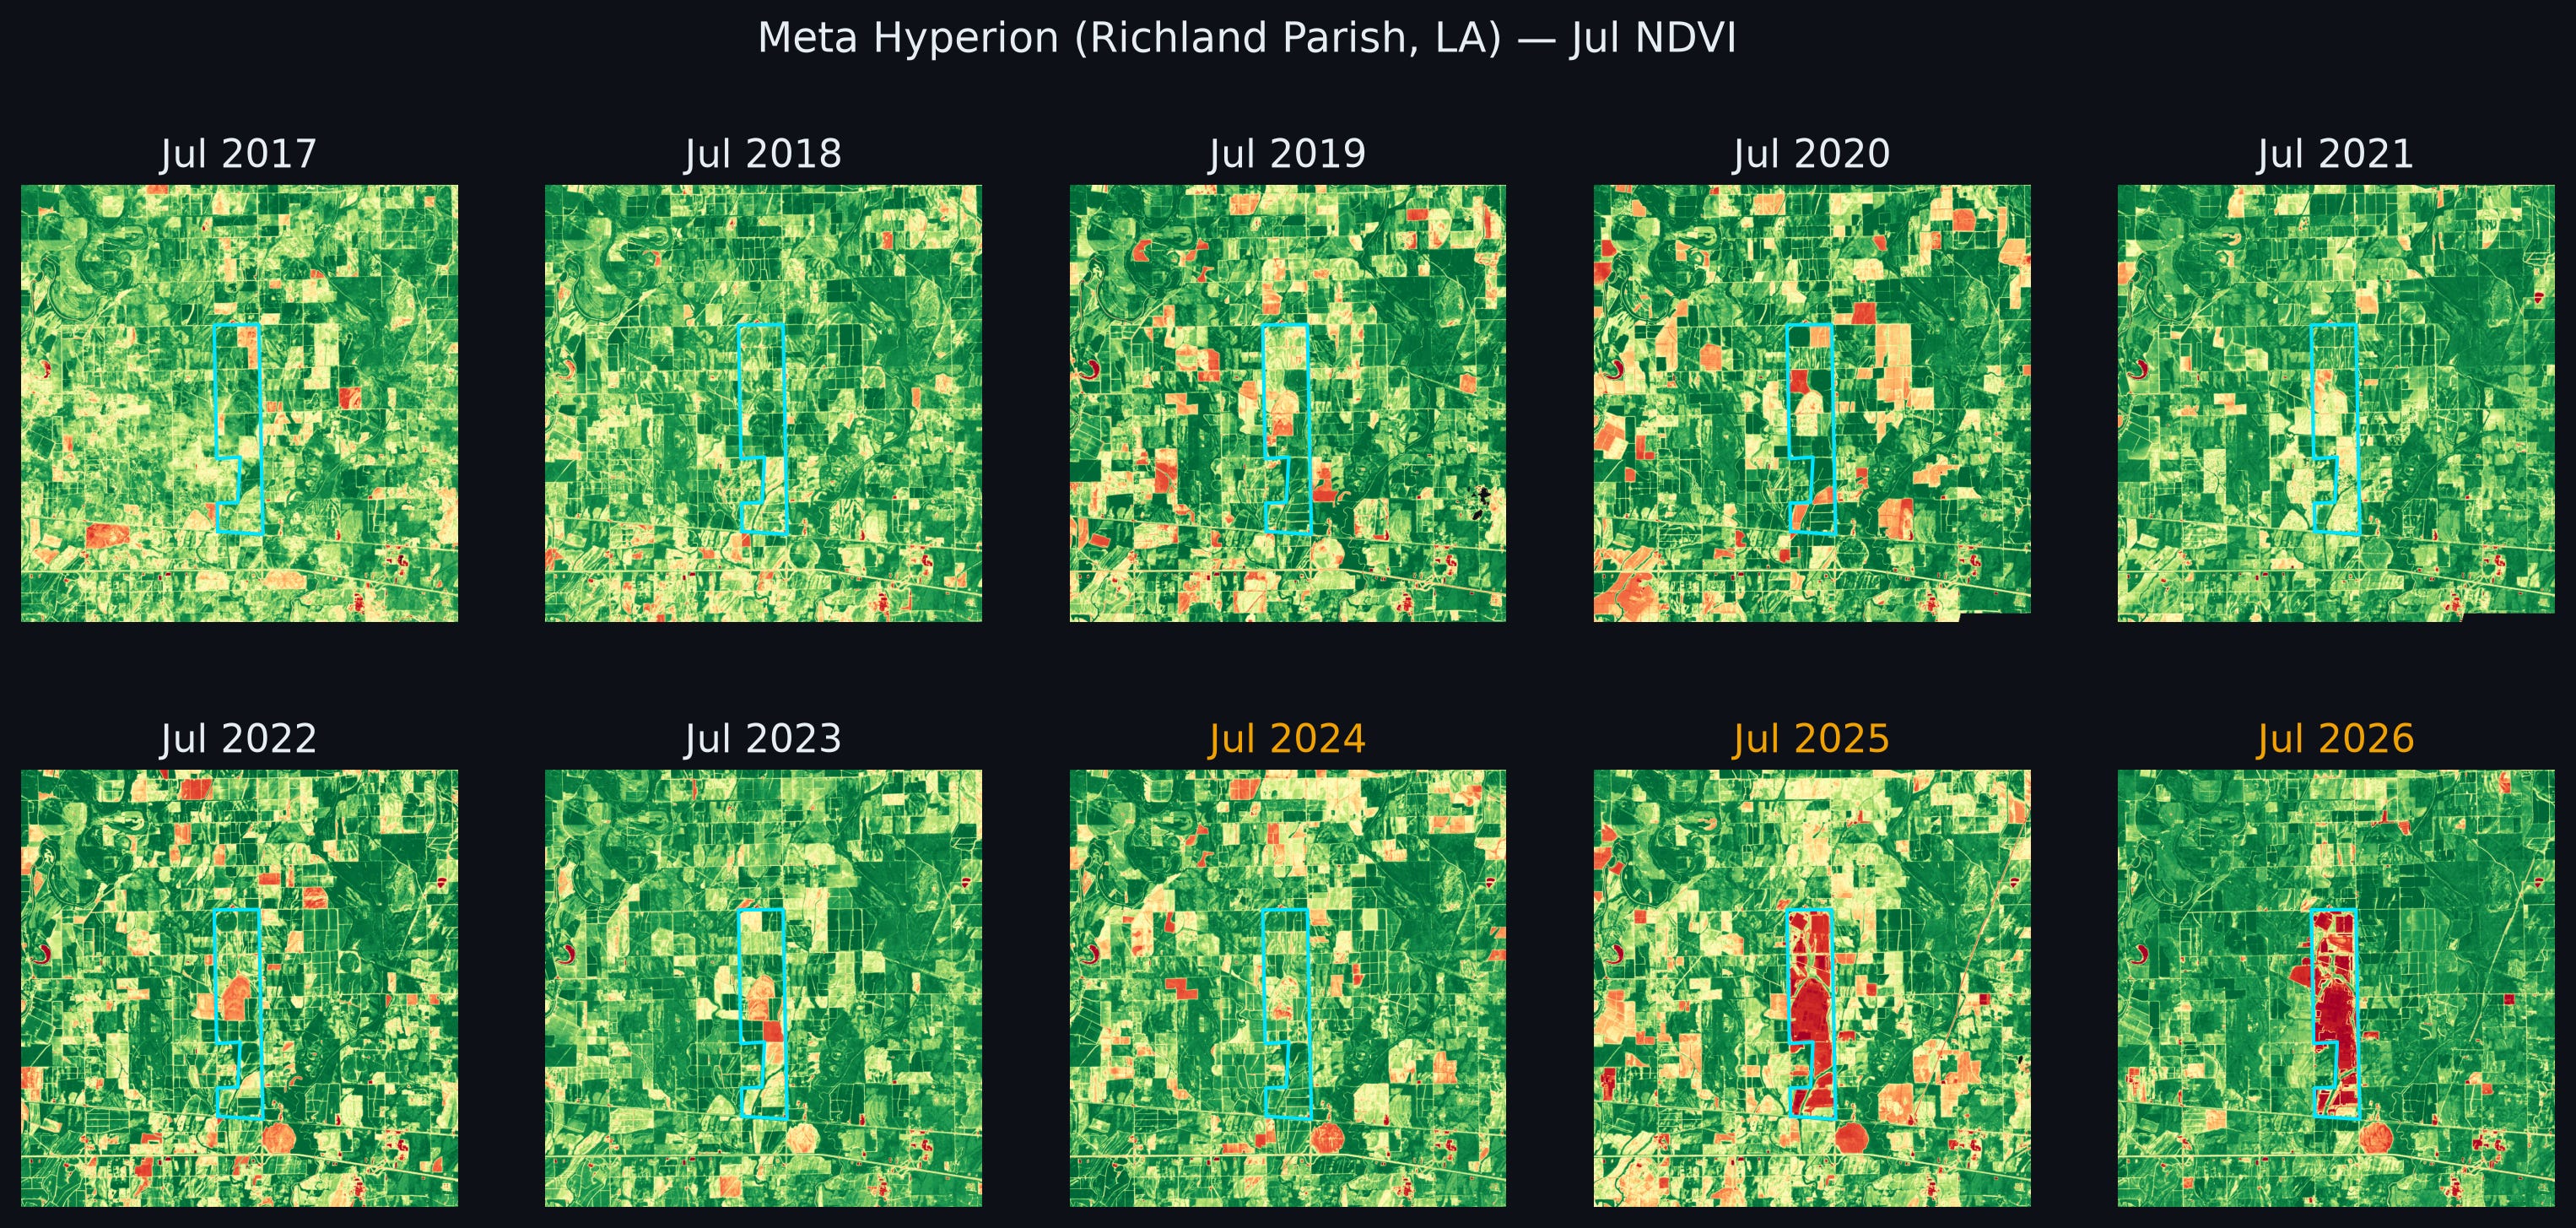
The method yields, per site and year, the footprint’s NDVI relative to its surroundings. A data center built during the observation window appears as a footprint NDVI that tracks its surroundings before construction and then drops sharply and persistently afterward, while the outer rings and reference remain stable—a spatial and temporal signature that is difficult to explain by regional or seasonal factors. We illustrate this raw-NDVI signature at the Meta Hyperion site, pairing a year-by-year sequence with a before-and-after NDVI comparison. Operationally, we register a construction break at a site where the reference-differenced footprint NDVI shows a sustained step decline relative to its pre-period level, and we label the change substantial when that decline reaches ΔNDVI ≥ 0.15.
Land-cover baseline
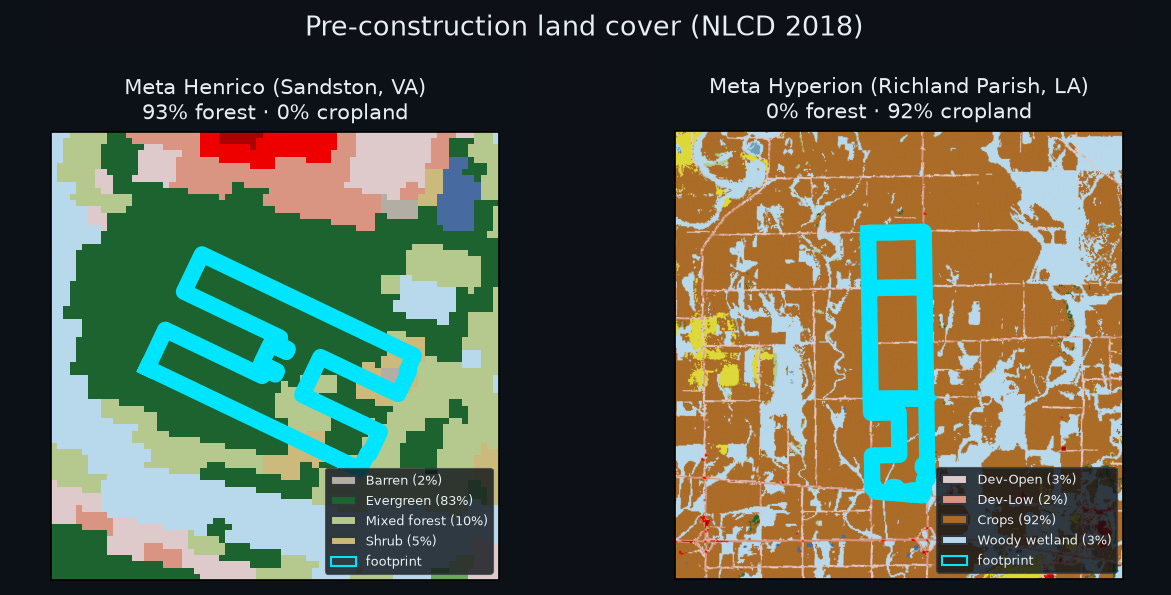
Measuring how much vegetation each site lost answers how much, but not what kind of land was converted—the question at the heart of the original controversy, which centered specifically on forest. To answer it, we characterize the land cover that existed at each footprint before construction using the National Land Cover Database (Annual NLCD Conterminous U.S. Collection 1.2 Land Cover; USGS EROS, DOI 10.5066/P143HE8T), a 30 m annually resolved land-cover product derived from Landsat time series using an ensemble of chained deep-learning models and harmonic time-series analysis, with classes based on a modified Anderson Level II classification system. We use the 2018 vintage as a common pre-construction baseline: it predates the construction of nearly all sites in the sample, and using a single year avoids conflating genuine land-cover differences between sites with year-to-year reclassification noise. For each site we reproject the NLCD raster onto the site’s analysis grid using nearest-neighbour resampling (appropriate for categorical data) and read the distribution of land-cover classes falling within the traced footprint. We then group the NLCD classes into interpretable buckets—forest (deciduous, evergreen, mixed), cropland (cultivated crops, pasture/hay), shrub and grassland, and developed (the four developed-intensity classes)—and assign each footprint the class that dominates its area.
Reading the signal — the Meta Hyperion exemplar
Before applying the method across all sites, we illustrate how the two diagnostic views are read using Meta Hyperion in Richland Parish, Louisiana—a data center built on farmland whose construction falls cleanly within the observation window, making it an ideal reference case.
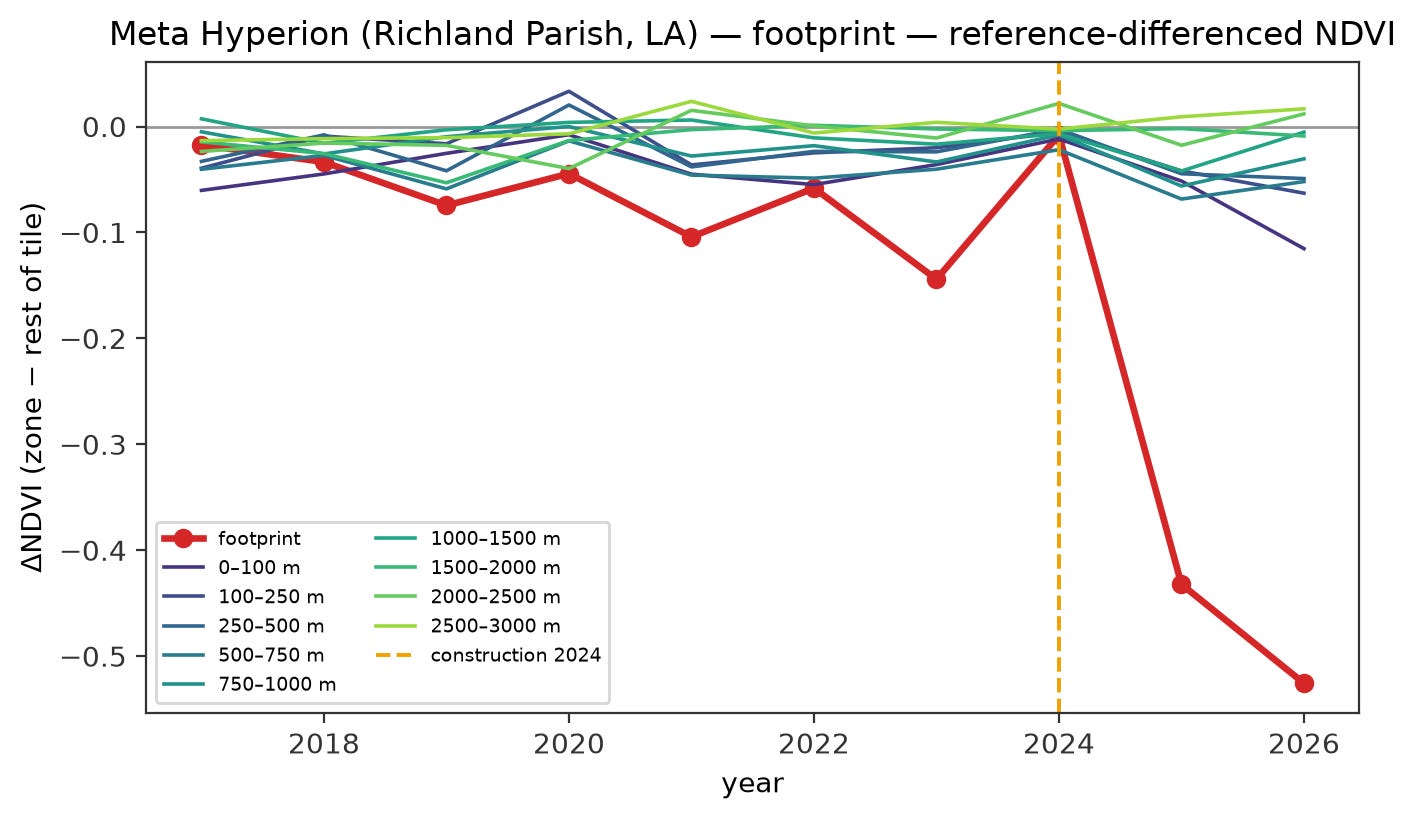
The reference-differenced NDVI time series plots, for each year, the NDVI of the footprint and of each concentric ring, expressed as a difference from the surrounding reference (the rest of the tile). Through 2017–2023 the footprint tracks its surroundings closely, staying within about ±0.15 and sharing the rings’ year-to-year wobble (dipping to about −0.15 in 2023)—confirming that the reference is well chosen and that the site behaved like ordinary farmland before construction. At the known construction date, the footprint diverges abruptly, falling to roughly −0.43 in 2025 and −0.53 in 2026, while every ring and the reference remain flat. The differencing removes the shared regional signal, so what remains is specific to the site: the sharp, sustained departure of the footprint from a landscape that did not change is the fingerprint of on-site land conversion.
The distance-decay view shows the same data as reference-differenced NDVI plotted against distance from the footprint edge. In the pre-construction years the curves are a flat tangle near zero at all distances. Only the post-construction years (2025–2026) punch a deep well at distance zero—about −0.4 to −0.5 at the footprint—that recovers to near zero within roughly 250 metres. This confirms that the loss is spatially confined to the site itself and does not extend into the surrounding landscape, ruling out a diffuse regional cause such as drought.
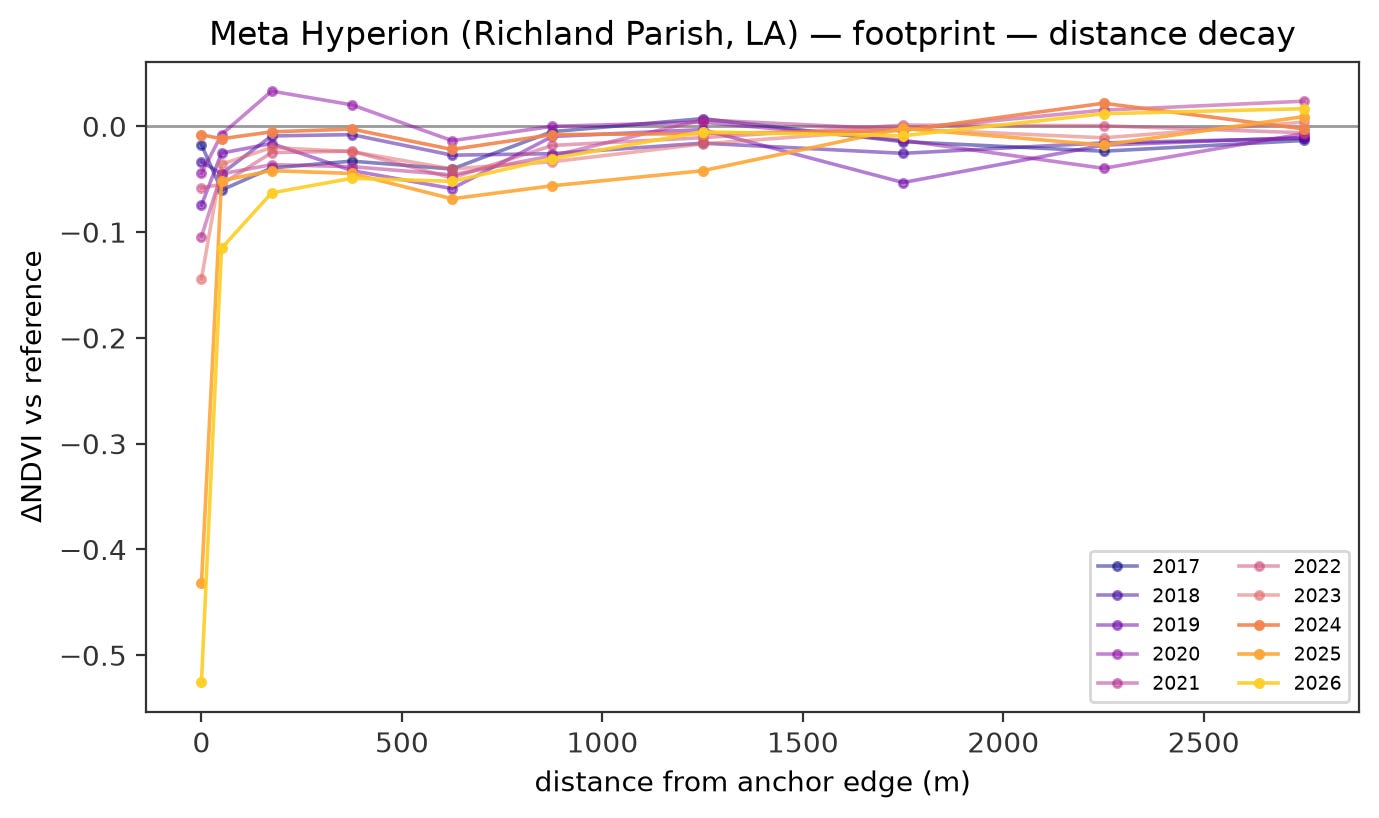
Read together, the two views form a causal argument that recurs across the sites analyzed below: the footprint co-moves with its surroundings until construction (establishing a valid baseline), then drops sharply while the surroundings stay flat (temporal specificity), and the drop is localized to the footprint and recovers with distance (spatial specificity). A change with this joint temporal and spatial signature, coinciding with the known construction date, is difficult to attribute to a diffuse or regional cause. We are explicit about what the index does and does not establish: the NDVI signal registers vegetation clearing; attribution of that clearing specifically to the data center rests on the hand-traced footprint and the known or detected construction date, not on NDVI alone.
For each site, a construction break is detected as the first year in which the footprint’s reference-differenced NDVI falls more than three standard deviations below the mean of the first three observation years (2017–2019), provided at least four valid annual composites are available; sites with no such crossing are classified as showing no detectable construction event. The three-year baseline and 3σ threshold are a deliberately conservative first-pass detector rather than a formal statistical test, and detections were confirmed by visual inspection. We label a detected change substantial when the post-break reference-differenced NDVI decline reaches ΔNDVI ≥ 0.15.
5. Results
Across the sample
Across the 42 sites, 19 show a detectable construction break in the reference-differenced footprint NDVI. Of these, 14 are substantial (ΔNDVI ≥ 0.15), with a median footprint NDVI drop of 0.35 and a maximum of 0.54. The remaining 23 sites are flat or pre-developed: their footprints show no vegetation transition within the satellite record, consistent with construction predating the 2017 archive or with sites built on already-cleared ground. We note that this break-versus-flat split is inferred from the NDVI record alone and is not yet validated against independent, per-site construction dates (see Discussion). Detected break years span 2020–2025 and peak in 2023. In every case with a detected loss, the decline is confined to the footprint while the concentric rings and reference remain stable—the spatial signature established for the Hyperion exemplar.
Representative sites
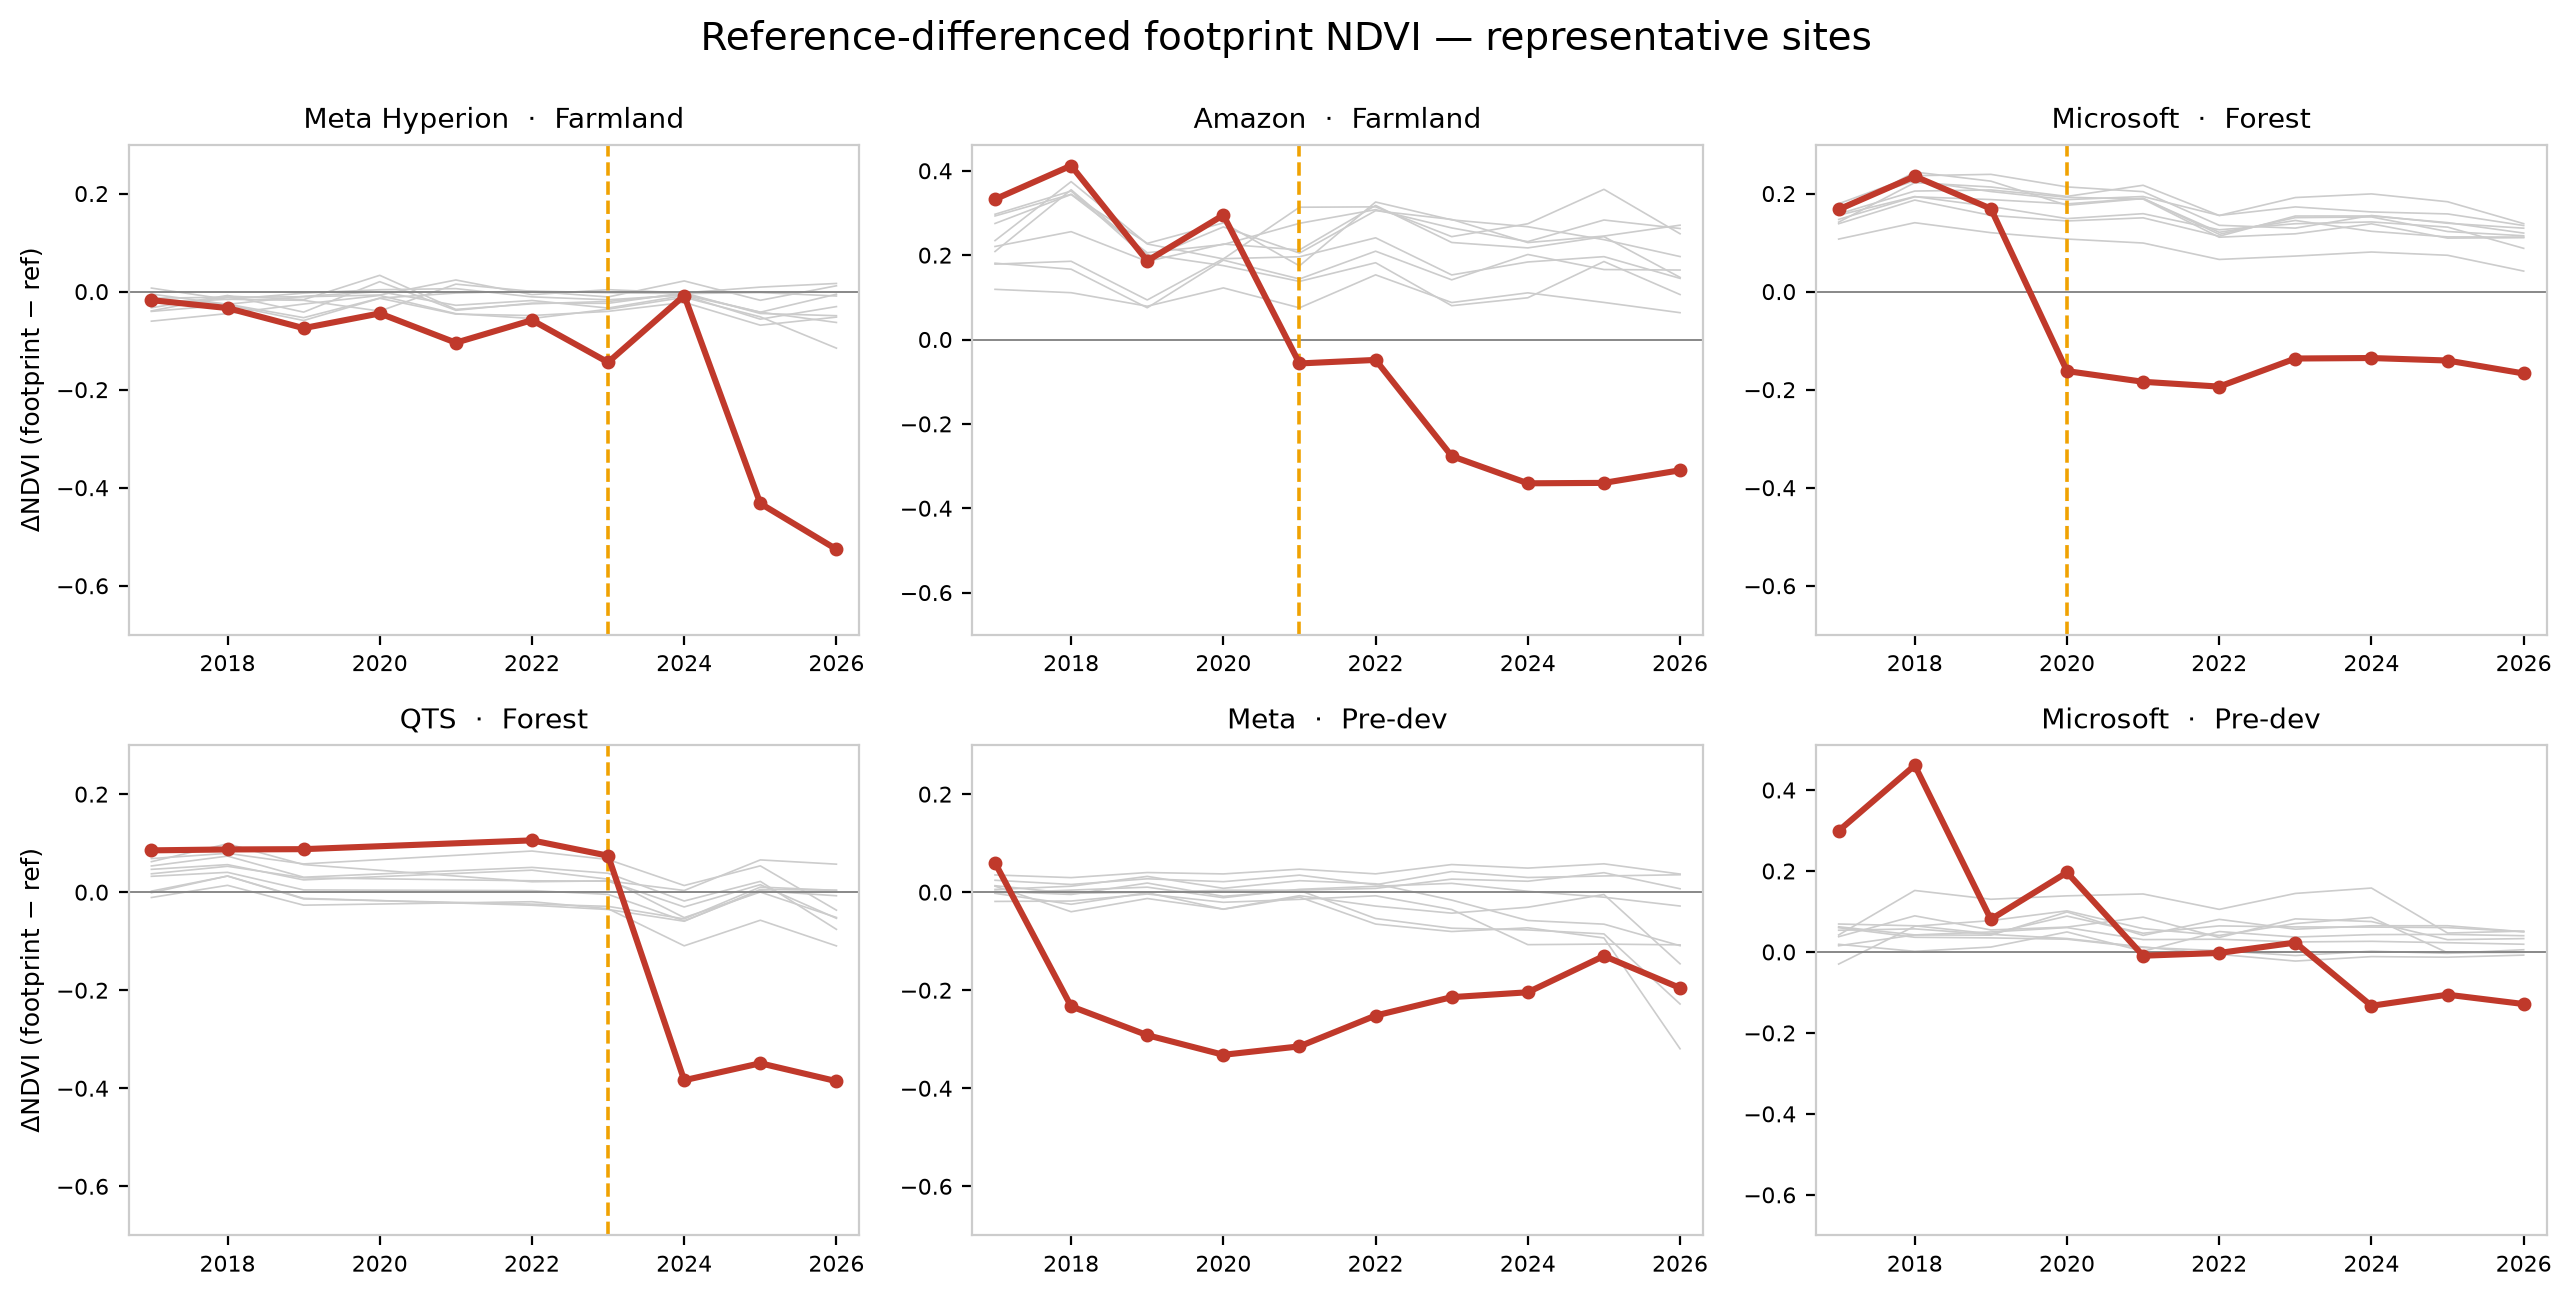
The reference-differenced footprint NDVI (red) for six representative facilities, with the concentric reference rings (grey) plotted behind each, shows that the surrounding landscape remained stable while the footprint changed; the vertical line marks the automatically detected break year.
The clearest cases are recent greenfield conversions. At Meta Hyperion (farmland, Louisiana), the footprint tracks its agricultural surroundings within about ±0.15 from 2017 through 2023 (dipping to about −0.15 in 2023), then falls abruptly after construction begins in 2024, reaching −0.43 in 2025 and −0.53 in 2026 while every ring holds near zero. The Amazon farmland site follows the same pattern with an earlier break in 2021: it sits above its surroundings through 2020—irrigated cropland is often greener than the surrounding landscape—then declines over the following years to a sustained −0.35 by 2024. The Microsoft forest site shows the signature most cleanly of all: a flat, slightly positive footprint through 2019, then a step down at the 2020 break to a stable −0.15 to −0.2, with the rings never departing from zero. The QTS forest site is similarly unambiguous, holding at its surroundings’ level until a 2023 break, then dropping to roughly −0.38.
Across these four, the shared structure is the evidence: a footprint that co-moves with its surroundings before construction, diverges sharply at the detected break, and settles at a persistent deficit—while the rings and reference remain flat throughout. The pre-construction agreement between footprint and surroundings validates the reference as a control, and the post-construction divergence, coinciding with the known or detected build date and confined to the footprint, is difficult to attribute to a regional cause—with attribution to the facility itself resting on the traced footprint and build date rather than on NDVI alone.
The remaining two panels illustrate less clean cases. One site shows an early, gradual decline bottoming near −0.33 around 2020 followed by partial recovery; another steps down only modestly to around −0.15 after 2023. These weaker or noisier trajectories—a gradual rather than abrupt change, or a shallow offset—are typical of sites where construction predates the reliable archive, where the footprint was only partially vegetated to begin with, or where interannual variability is high. They motivate the site classification used in the land-cover analysis below, which separates facilities with a clean construction signal from those already developed—the two “pre-developed” panels here, whose developed NLCD baseline matches their weak, gradual trajectories—or too noisy to resolve.
6. Land cover — what the largest data centers were built on
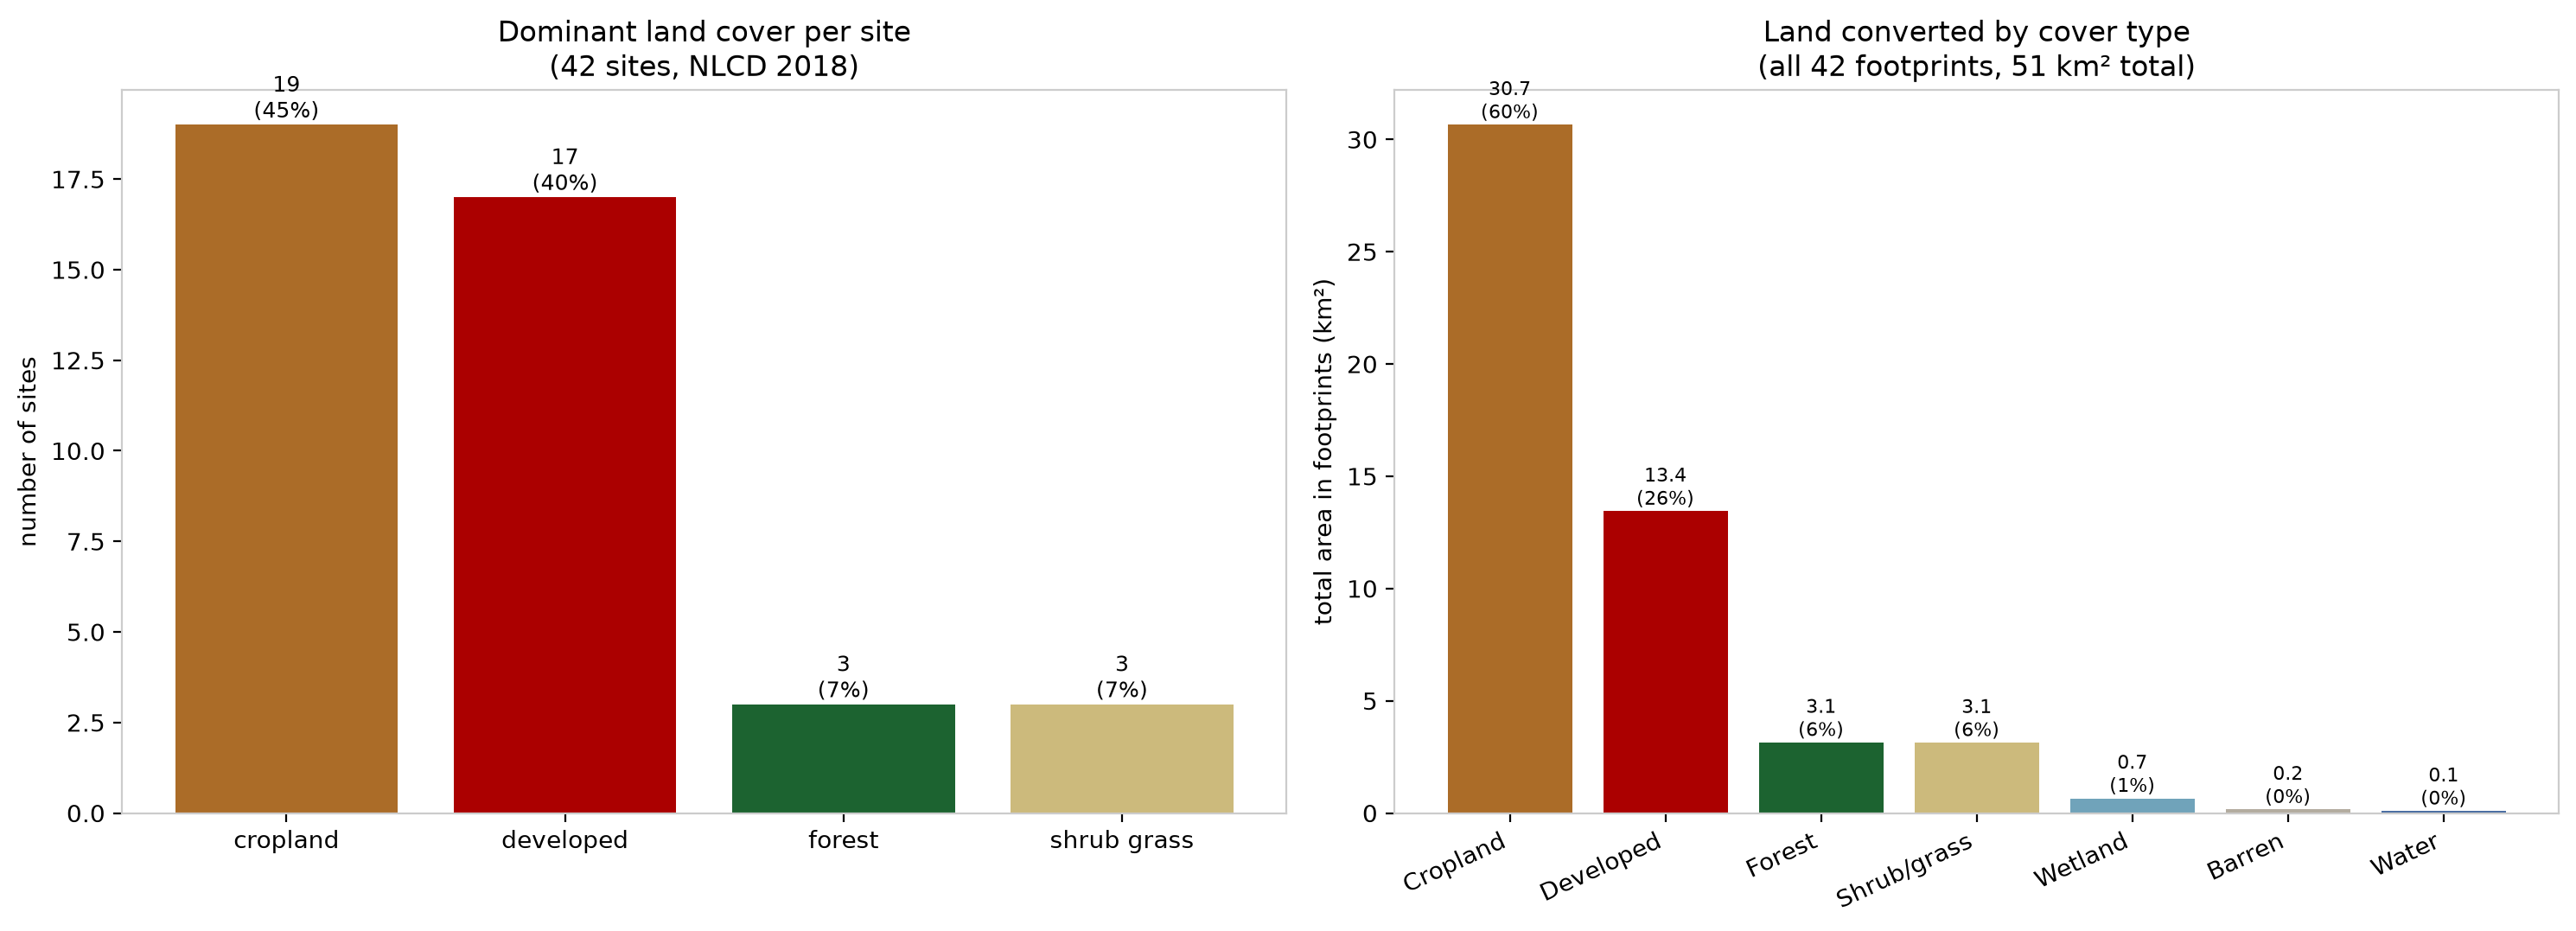
Applying the land-cover classification across all 42 sites yields the headline result. By converted land area—the more informative measure, since a per-site dominant-class label collapses each footprint to one category and hides the minor covers actually present—the largest U.S. data centers were built overwhelmingly on cropland and previously developed land. Of the roughly 51 km² of combined footprints, cropland accounts for about 30.7 km² (60%) and already-developed land for about 13.4 km² (26%), while forest makes up only about 3.1 km² (6%), shrub/grassland about 3.1 km² (6%), and wetland, barren, and water together under 1 km². The per-site dominant-class counts give the same ranking: cropland is dominant at 19 of 42 sites (45%), developed at 17 (40%), and forest and shrub/grassland at 3 each (7%). Note that the land-cover result is derived directly from the NLCD baseline within each footprint and does not depend on break detection; it therefore holds regardless of whether a construction event is temporally resolved in the NDVI series.
The gap between the count and area shares is itself informative. Cropland is over-represented by area (45% of sites but 60% of converted land), because the largest greenfield campuses—Meta Hyperion among them—sit on farmland; conversely, developed land is under-represented by area (40% of sites but 26% of converted land), consistent with the reuse of smaller, already-built parcels. Forest and shrub/grassland footprints are close to average size, so their count and area shares roughly agree. In every framing, the dramatic forest-clearing imagery that motivated this study—real, as the Henrico exemplar confirms—describes an atypical case among the highest-consumption facilities.
This reframes the viral claim quantitatively. Forest conversion by data centers is real—the Henrico exemplar confirms it—and, where it occurs, produces the cleanest NDVI losses in our sample (though this rests on only three forest sites and is therefore suggestive rather than established; see Discussion); but at the scale of the largest facilities it is the exception, not the rule: forest is about 6% of the converted area. The dominant patterns are the conversion of agricultural land and the reuse of previously developed sites—the latter accounting for the large group of facilities that show no vegetation transition within the satellite record because they were built on already-cleared ground.
Two coincident counts in this study invite misreading and should be kept distinct. First, the developed-baseline count (17, from NLCD) and the flat/no-break count (23, from the NDVI analysis) are related but not identical measures—a cropland site built before 2017, for instance, would register as both flat and cropland—so we do not map one onto the other. Second, and for the same reason, the 19 sites with a detected construction break are not the same set as the 19 cropland sites, despite the coincident value: the break set includes the forest and shrub/grassland conversions along with cropland sites built during the observation window, whereas cropland sites built before 2017 register as cropland but show no break. The matching numbers are a coincidence of the sample, not a mapping.
The concern voiced in the public reaction is therefore best understood as a question of siting: the environmental cost of a data center depends heavily on whether it displaces forest, farmland, or prior development, and across the largest U.S. facilities the balance falls mainly on the latter two.
7. Discussion and limitations
Several limitations bound these results. First, the sample is defined by energy, which skews it away from forest: the largest-consumption facilities are disproportionately on farmland and prior development, so the ~6% forest area share (7% of sites by count) characterizes the largest facilities, not data centers in general. Second, the NLCD baseline is a fixed 2018 vintage, so for sites cleared well before or after 2018 it only approximates true pre-construction cover. Third, the forest subsample is small (n = 3), so any forest-versus-cropland comparison of drop magnitude is suggestive rather than conclusive, and we do not report it as a headline result. Fourth, a large share of the sample shows no measurable vegetation transition: 23 sites (55%) are flat or pre-developed in the NDVI record, and 17 (40%) are developed by the 2018 NLCD baseline; these overlap but are not identical, since a cropland site built before 2017 reads as flat without being developed. For this portion of the sample there is no on-site transition to measure.
Several extensions would sharpen the picture: lowering the energy floor to admit more mid-sized and forest sites; collecting per-site construction dates to replace the fixed baseline and validate break years; quantifying break-detection error rates against ground-truth construction dates; and integrating vegetation loss with the energy and water footprints, so land, energy, and water costs can be weighed together.
8. Conclusion
Motivated by a viral image of a data center rising over cleared forest, we built a season-controlled, reproducible, multi-site pipeline to replace anecdote with measurement. Using free Sentinel-2 imagery, phenology-matched peak-greenness compositing, and reference-differencing against each site’s own surroundings, we measured vegetation change at the 42 largest U.S. data centers and used the 2018 NLCD baseline to characterize what each replaced. Nineteen sites show a construction break (2020–2025, peaking in 2023), fourteen with a substantial NDVI loss confined to the footprint. The finding is one of siting: by converted area, these facilities are built overwhelmingly on cropland (≈ 60% of the ≈ 51 km² of footprints) and already-developed land (≈ 26%), with forest only about 6%. Forest conversion is real and produces the clearest losses where it occurs, but among the largest facilities it is the exception, not the rule. The viral claim is thus best resolved not as confirmation or dismissal, but as a question of where these facilities are built—and, for the largest, the answer is mostly farmland and already-developed ground.
Declarations
Funding. This research received no external funding.
Data availability. All input datasets are publicly available from the sources cited. Site footprints were hand-traced from public satellite and OpenStreetMap imagery.
Use of AI tools. Generative AI tools were used to assist with language refinement and code development.
References
Mytton, D. Data centre water consumption. npj Clean Water 4, 11 (2021). https://doi.org/10.1038/s41545-021-00101-w
Siddik, M. A. B., Shehabi, A. and Marston, L. The environmental footprint of data centers in the United States. Environmental Research Letters 16(6), 064017 (2021). https://doi.org/10.1088/1748-9326/abfba1
Epoch AI. Introducing the Frontier Data Centers Hub. Epoch AI (2025). https://epoch.ai/blog/introducing-the-frontier-data-centers-hub/
Krawec, C. Tracking Hyperscale AI Data Center Growth with Satellite Imagery. Federation of American Scientists (2026). https://fas.org/publication/tracking-hyperscale/
Business Insider. Satellite images show how data centers are changing America’s landscape. Business Insider (2025). https://www.businessinsider.com/satellite-images-show-how-data-centers-changing-american-landscape-2025-10
Tucker, C. J. Red and photographic infrared linear combinations for monitoring vegetation. Remote Sensing of Environment 8(2), 127–150 (1979). https://doi.org/10.1016/0034-4257(79)90013-0
Hansen, M. C., Potapov, P. V., Moore, R., Hancher, M. et al. High-resolution global maps of 21st-century forest cover change. Science 342(6160), 850–853 (2013). https://doi.org/10.1126/science.1244693
Herbei, M. V., Badea, A. C., Radu, S. M., Lorinț, C., Herbei, R. C., Bertici, R., Dragomir, L. O., Popescu, G., Smuleac, A. and Sala, F. AI-Supported Detection of Vegetation Degradation and Urban Expansion Using Sentinel-2 Multispectral Data: Case Study. Land 15(1), 140 (2026). https://doi.org/10.3390/land15010140
Corbane, C. et al. A global cloud-free pixel-based image composite from Sentinel-2 data. Data in Brief 31, 105737 (2020). https://doi.org/10.1016/j.dib.2020.105737
Baetens, L., Desjardins, C. and Hagolle, O. Validation of Copernicus Sentinel-2 cloud masks obtained from MAJA, Sen2Cor, and FMask processors. Remote Sensing 11(4), 433 (2019). https://doi.org/10.3390/rs11040433
U.S. Geological Survey. NDVI, the Foundation for Remote Sensing Phenology. U.S. Geological Survey (2018). https://www.usgs.gov/special-topics/remote-sensing-phenology/science/ndvi-foundation-remote-sensing-phenology
Lovell, R. S. L., Collins, S., Martin, S. H., Pigot, A. L. and Phillimore, A. B. Space-for-time substitutions in climate change ecology and evolution. Biological Reviews 98(6), 2243–2270 (2023). https://doi.org/10.1111/brv.13004
U.S. Geological Survey / USGS EROS. Annual NLCD Conterminous U.S. Collection 1.2 Land Cover. U.S. Geological Survey data release (2024). DOI 10.5066/P143HE8T (Land Cover product); umbrella release DOI 10.5066/P94UXNTS. https://www.mrlc.gov/data/project/annual-nlcd
Yang, L., Jin, S., Danielson, P., Homer, C. et al. A new generation of the United States National Land Cover Database: Requirements, research priorities, design, and implementation strategies. ISPRS Journal of Photogrammetry and Remote Sensing 146, 108–123 (2018). https://doi.org/10.1016/j.isprsjprs.2018.09.006
Homer, C., Dewitz, J., Jin, S., Xian, G. et al. Conterminous United States land cover change patterns 2001–2016 from the 2016 National Land Cover Database. ISPRS Journal of Photogrammetry and Remote Sensing 162, 184–199 (2020). https://doi.org/10.1016/j.isprsjprs.2020.02.019
Shehabi, A., Smith, S. J., Hubbard, A., Newkirk, A., Lei, N., Siddik, M. A. B., Holecek, B., Koomey, J., Masanet, E. and Sartor, D. 2024 United States Data Center Energy Usage Report. Lawrence Berkeley National Laboratory, LBNL-2001637 (2024). https://doi.org/10.71468/P1WC7Q
International Energy Agency. Energy and AI. IEA, Paris (2025). https://www.iea.org/reports/energy-and-ai
Drusch, M., Del Bello, U., Carlier, S., Colin, O. et al. Sentinel-2: ESA’s Optical High-Resolution Mission for GMES Operational Services. Remote Sensing of Environment 120, 25–36 (2012). https://doi.org/10.1016/j.rse.2011.11.026
STAC Contributors. SpatioTemporal Asset Catalog Specification (v1.1.0). stacspec.org (2024). https://stacspec.org/
Element 84. Earth Search STAC API. Element 84 (2024). https://github.com/Element84/earth-search
Open Geospatial Consortium. Cloud Optimized GeoTIFF Standard v1.0. OGC (2023). https://docs.ogc.org/is/21-026/21-026.html
Janosov, M. How Much of the United States Can Still Host New Hyperscale Data Centers? A Constraint-Based Feasibility Analysis. arXiv preprint (2026). https://arxiv.org/abs/2602.02529